
Creating a positive work environment is not only essential to employee engagement but also influences the success of your manufacturing company. To achieve that goal, leaders must understand what contributes to their workers’ morale, what challenges employees face, and what members of the workforce believe creates a great work environment.

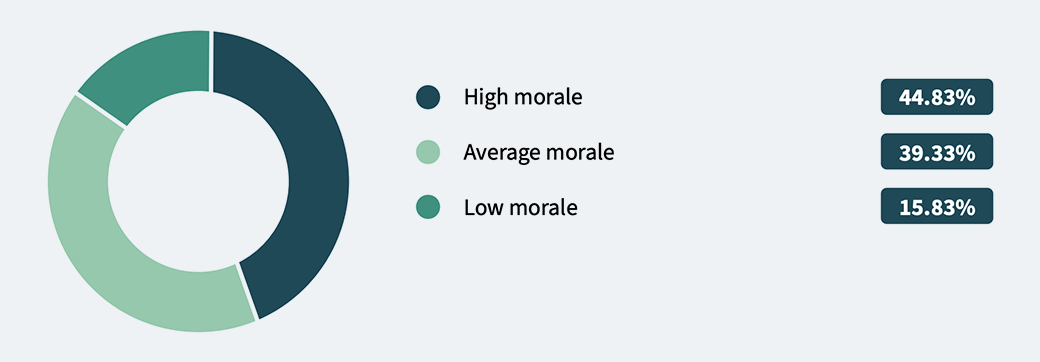
When rating morale, 45% say morale is high, while 39% say morale is average and 16% say morale is low.
Compared to last year’s report, high morale has dropped from 52% to 45%, while low morale increased from 7% to 16%.
When looking at various segments, high morale for women dropped from 52% last year to 43% this year, and high morale for men dropped from 52% last year to 47% this year.
The biggest drop was in younger respondents ages 18 to 34, going from 50% last year to just 39% this year.
How would you rate morale at your current company?
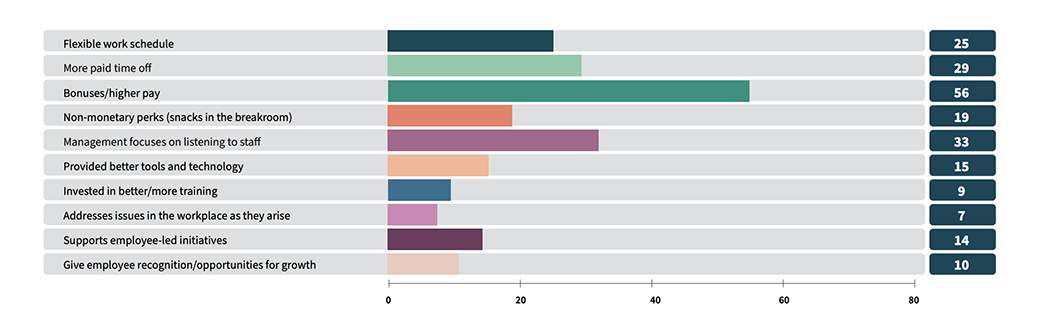
In this year's survey, the largest segment of respondents (24%) attribute high morale to bonuses or higher pay, making it the top reason compared to last year when it ranked third. Flexible work schedules, listening to staff concerns, and more paid time off also contribute to high morale.
In looking at different demographics, younger respondents aged 18 to 34 now say higher pay increases morale over more paid time off, which was their top reason last year.
Similarly, women now cite higher pay as increasing morale, whereas it was flexible work schedules previously. For men, bonuses or higher pay remains the leading cause of high morale, whereas last year it was more paid time off.
[If high morale] What's the #1 thing your company has done to create high morale at your company?
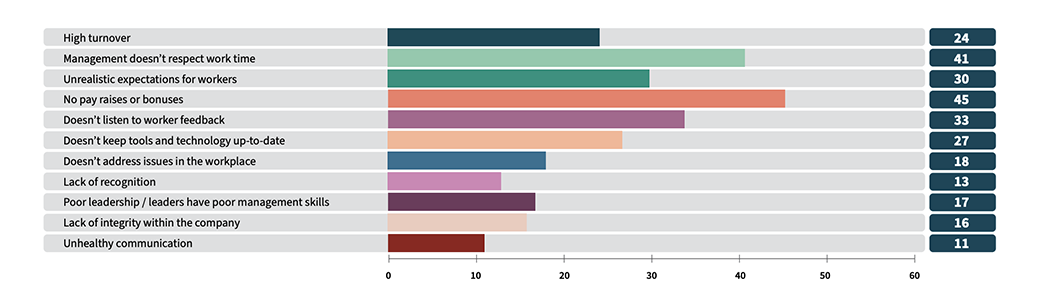
In this year's survey, the largest segment of respondents (14%) attribute low morale to no pay raises or bonuses, making it the top reason compared to last year when it ranked third.
Other contributors to low morale include management not respecting work time, high turnover, unrealistic expectations, and ignoring worker feedback. These reasons rose from lower spots last year.
Younger respondents ages 18 to 34 attribute low morale to unrealistic expectations for workers, whereas last year it was poor leadership. Women attribute low morale to no pay raises or bonuses, over last year’s top reason of poor leadership.
[If low morale] What's the #1 thing your company has done to create low morale at your company?
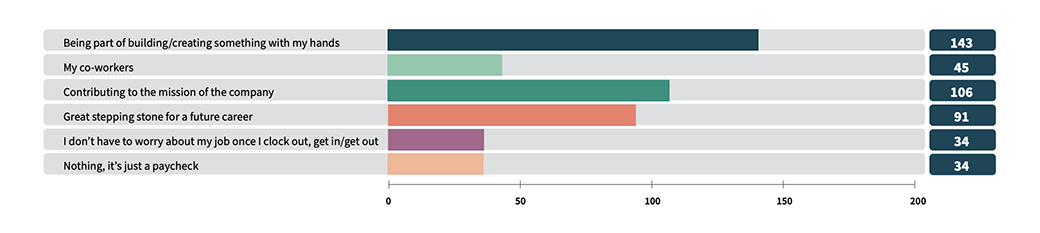
Respondents this year say the most enjoyable aspect of work is being part of building or creating something with their hands (29%). This was also last year’s top reason overall, and the reason across various demographics.
Other enjoyable aspects include contributing to the mission of the company and future career opportunities.
What do you enjoy the most about your work?
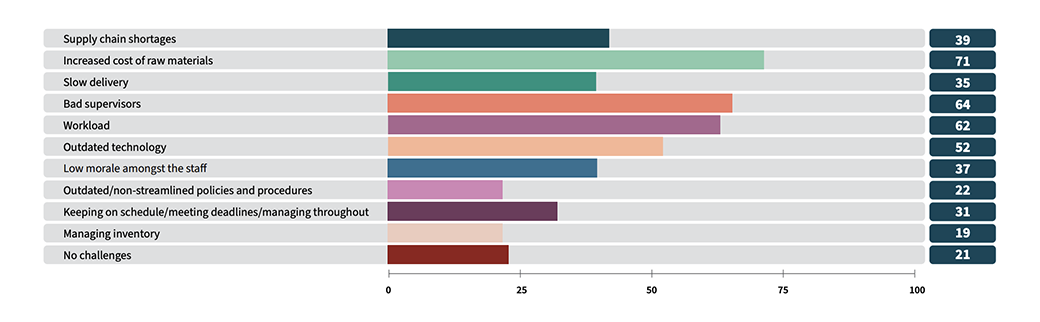
This year’s biggest work challenge is the increased cost of raw materials (15%), which was last year’s top challenge as well.
Other challenges include bad supervisors, workload, and outdated technology, which all moved up the list from last year.
Younger respondents ages 18 to 34 say their top challenge is bad supervisors, changed from last year’s increased cost of raw materials. Women say their top challenge is also bad supervisors, changed from last year’s supply chain shortages.
This year and last, respondents from smaller companies (<500 employees) say their top challenge is the increased cost of raw materials.
This year, respondents from larger companies (500< employees) say their top challenge is a tie with the increased cost of raw materials, bad supervisors, and keeping on schedule, whereas last year it was supply chain shortages.
What is your greatest challenge at work?
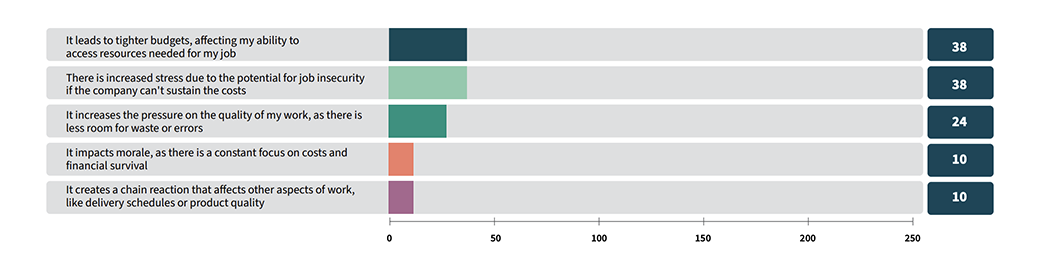
The biggest impact of the increased cost of raw materials is the resulting tightening of company budgets, affecting workers' ability to access resources needed for their job (54%).
Another impact is increased stress due to the potential for job insecurity if the company can't sustain the increased costs.
Women say the biggest impact is increased stress due to the potential for job insecurity if the company can't sustain the costs. Men say it’s tighter budgets, affecting their ability to access resources needed for their job.
[If Increased cost of raw materials] How do the increased costs of raw materials directly impact your work? (Select all that apply)
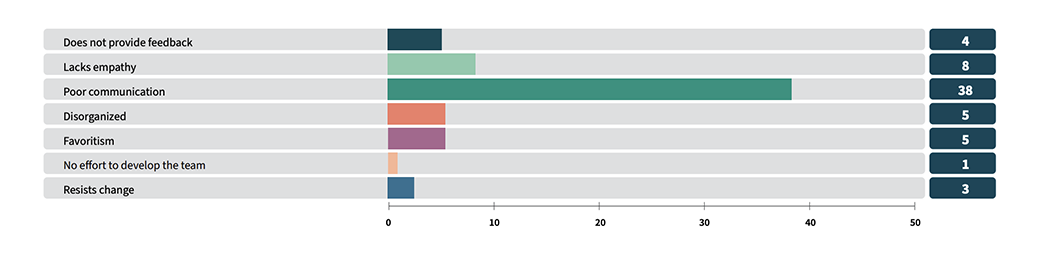
What makes a bad supervisor? 54% say poor communication, which was also the top reason from last year.
Other attributes are favoritism and a lack of empathy.
Both this year and last, younger respondents ages 18 to 34 say the top attributes are poor communication and favoritism. Both this year and last, women say the top attributes are poor communication and lack of empathy. Men say the top attributes are poor communication and favoritism, whereas last year they said poor communication and lack of empathy.
[If bad supervisor] What would you say is the number one thing that makes them a bad supervisor?
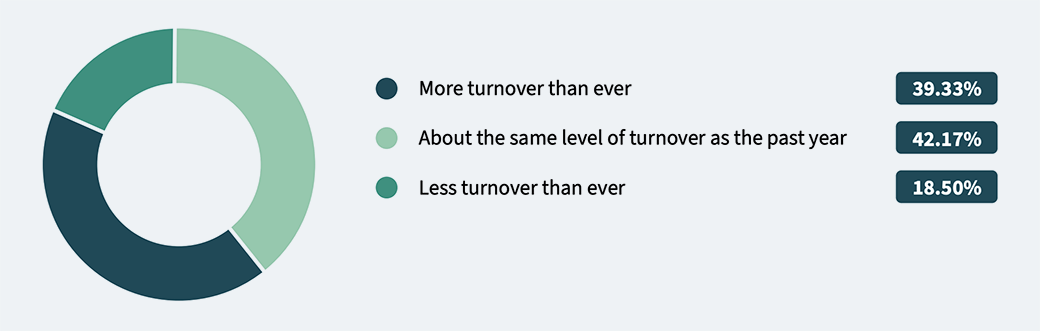
39% are seeing more turnover than ever. 42% say they’re seeing about the same level of turnover as the past year, while 19% are seeing less turnover than ever.
Compared to last year, turnover is decreasing, from 45% seeing more turnover than ever to 39%.
Respondents from smaller companies who say they’re seeing more turnover than ever dropped from 41% last year to 39% this year. Respondents from larger companies who say they’re seeing more turnover than ever dropped from 54% last year to 42% this year.
How would you describe turnover (people quitting, furloughed, or getting fired) at your company?
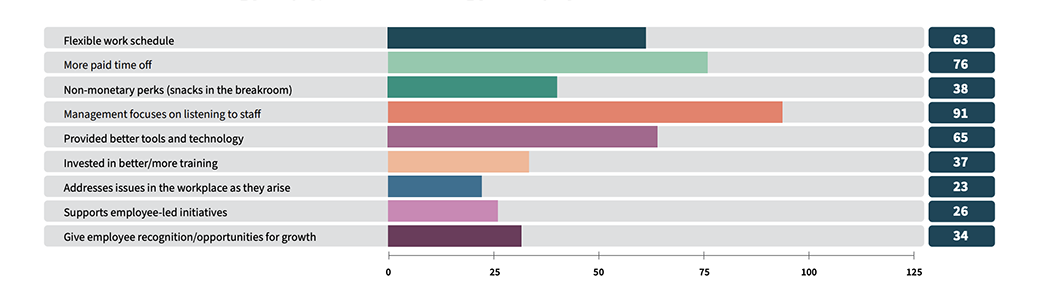
To create a better work environment, management should focus on listening to staff (18%), which rose from fourth last year to first this year.
Other initiatives include more paid time off, flexible work schedules, and providing better tools and technology, which also rose from last year.
This year, women say the top initiative is for management to focus on listening to staff, whereas last year it was more paid time off. Both this year and last year, men say the top initiative is more paid time off.
Outside of increasing your pay, what’s the #1 thing your employer could do to create a better work environment?
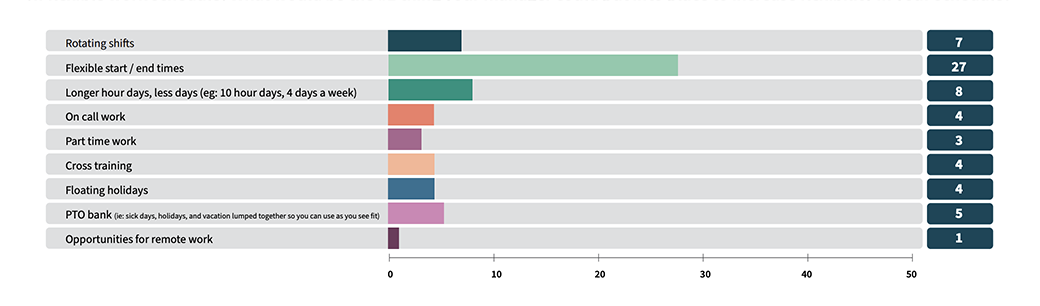
When implementing a flexible schedule, 48% want flexible start and end times.
Other options include longer hours/fewer days or rotating shifts.
Women prefer flexible start and end times, and a tie of longer hours/fewer days and rotating shifts. Men prefer flexible start and end times and longer hours/fewer days.
[If flexible work schedule] What would be the #1 thing your manager could put into place to increase flexibility in your schedule?
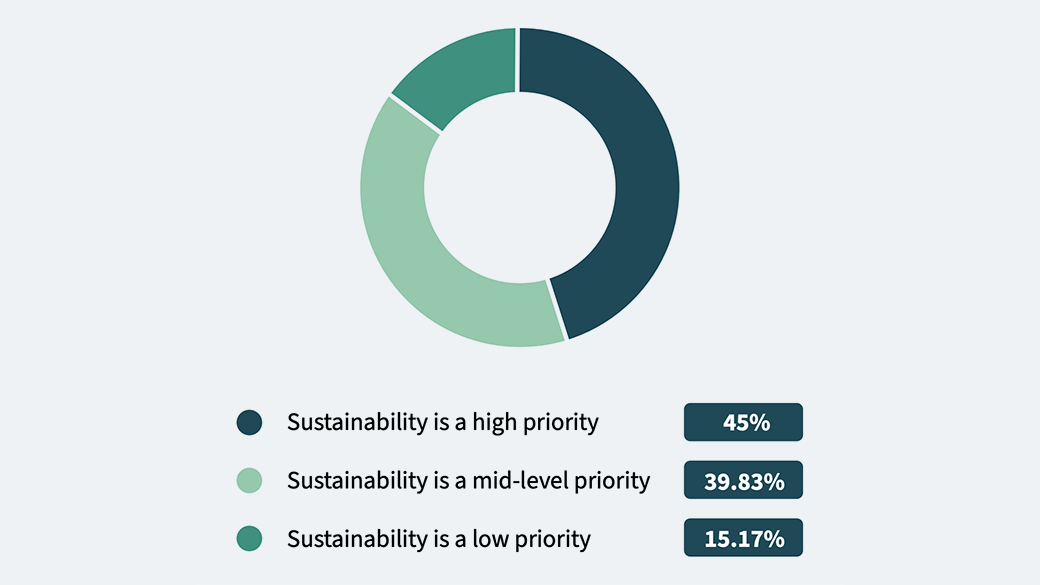
45% of our respondents say that their organization makes sustainability a high priority. For 40%, sustainability is a mid-level priority, while for 15%, sustainability is a low priority.
Those responding “high priority” dropped from 49% last year to 45% this year. Those with sustainability as a low priority went from 6% to 15%.
Younger respondents ages 18 to 34 who responded “high priority” dropped from 47% last year to 41% this year. Women who responded “high priority” dropped from 54% last year to 42% this year. Men who responded “high priority” increased slightly from 46% last year to 48% this year.
Respondents from smaller companies who responded “high priority” increased slightly from 45% last year to 46% this year. Respondents from larger companies who responded “high priority” dropped from 58% last year to 43% this year.
Is your organization making sustainability a priority?
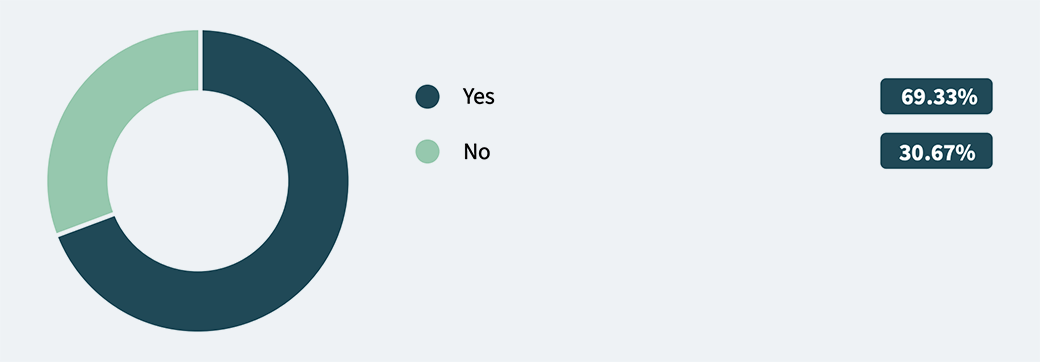
69% said they do feel adequately compensated, while 31% don’t.
Those who feel adequately compensated dropped from 83% last year to 69% this year.
Younger respondents ages 18 to 34 who are adequately compensated dropped from 80% last year to 67% this year. Women who are adequately compensated dropped from 82% last year to 72% this year.
Do you feel you are fairly compensated for the work you do?
The day-to-day life of a manufacturing worker isn’t overly negative, but neither is it overly positive. Only 45% say their morale is high, which is caused by bonuses or higher pay, flexible work schedules, and management listening to staff. However, 16% say their morale is low, citing reasons that include no pay raises or bonuses and that management doesn’t respect work time. Only 69% feel adequately compensated for the work they do.
The biggest challenges they face each day include the increased cost of raw materials, bad supervisors, and workload. However, it’s not necessarily the increased cost of raw materials that impacts accessing resources or creates the potential for job insecurity. Those are byproducts of the fear that their company won’t be able to properly manage the increased costs of raw materials.
How can their leaders improve the work environment? Through listening to staff, more paid time off, flexible work schedule — most just want flexible start and end times — and by providing better tools and technology.
At the end of the day, most still enjoy being part of building and creating something with their hands.
When comparing this year’s responses to last year’s report, here’s what stands out:
To truly help their businesses evolve, scale, and thrive in the months ahead, leaders need to take this information and implement the necessary tools, solutions, and changes to improve morale and fill any gaps in existing processes. At Epicor, we understand that any manufacturing business is only as strong as its valuable workforce. We’re ready to work with you to help you reach your potential and achieve your goals.